November 29, 2017
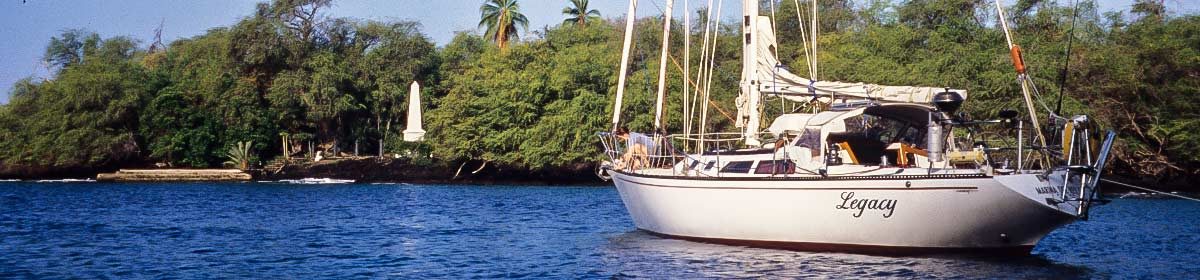
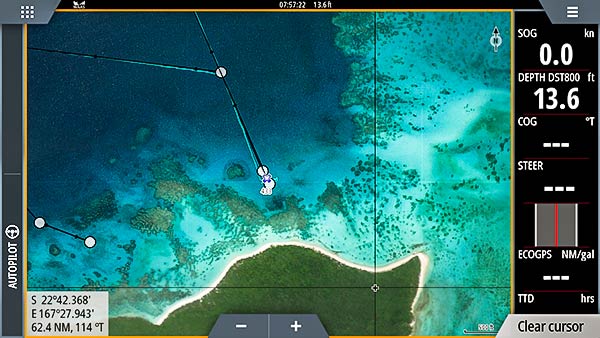
About a week ago, we wrote about the New Toys we were installing on Legacy – new chartplotters to replace our older, failing plotters along with forward looking sonar. One of the new units arrived defective and while we’re waiting for the replacement, I’ve been trying to get a feature working that I’ve wanted for so long: Satellite images displayed on the chartplotter for navigation! I’m getting there. See…
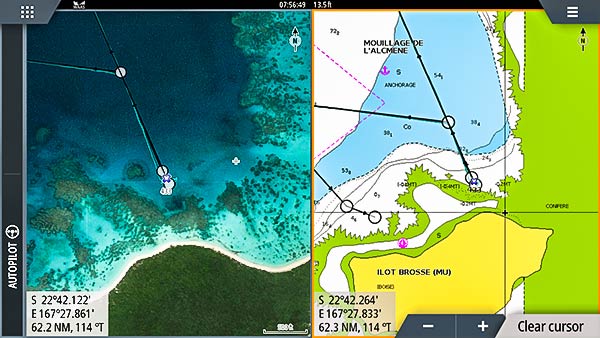
You can even view both the satellite image and chart (Navionics in this case) simultaneously…
And it’s not just viewing these charts that’s the holy grail for me. I could always do that on my tablet, but it’s being able to use the satellite image directly for navigation with routes, waypoints and the boat’s position displayed directly on the satellite image.
The other huge advantage is that almost all tablet displays are terrible outdoors. Our hew Simrad NSS9 EVO3 plotters have a beautifully bright screen that is so easy to see, even in direct sunlight.
Insight Map Creator
To make this possible, I’m using a free program called Insight Map Creator (IMC) to create the .at5 files that will display on the plotter. You can find a link to it on our “links” page. It’s been quite a steep learning curve. When I’ve got it figured out, I’ll make a video and post it on our blog.
I’m making charts for New Caledonia right now (since that’s where we are, waiting for suitable weather to get to NZ). Each run of IMC is taking about 20 hours and that’s on our very fast Intel Core i7 laptop. One reason it’s taking so long is that I’ve gotten greedy!
I used to be happy with simple little .kap files made from GE2KAP or ChartAid. I’d capture a satellite image for an area I might want to anchor or transit and make just a small satellite image of that area. Enter SASPlanet and ESRI ArcGIS.imagery. These satellite images are stunning in their clarity and detail, at least here in New Caledonia and several other places I’ve viewed. Since I’ve seen these images, and since I can now load them on my chartplotter, I WANT IT ALL!
I’ve made charts for the bottom half of New Cal and it takes up about 30GB on my 32GB micro-SD card. (Good thing they’re cheap. I can just buy them by the dozen and swap them in and out of my chartplotter as needed.) These images are so much better than the .kap files I used to make. For one thing, the ArcGIS imagery is better than what I’ve used before, but also, there is greater color resolution when doing things this way.
Normally, the .kap files have 8 bit color and a lot of detail is or can be lost because of this low level of color resolution. While I don’t know exactly what the color depth is in the resulting .at5 files, it looks stunning. There is so much detail I think I might be able to see individual seacucumbers on the bottom!
Satellite Images as Art
Some of these images are so beautiful, I’d mount them on wall (if I had walls, that is). See this one below. Again, it’s the ESRI ArcGIS.imagery displayed in SASPlanet.
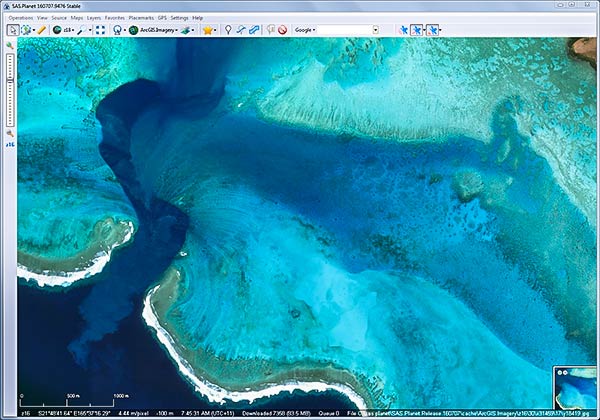
Zooming in shows the amazing details made by centuries of water flow into and out of the reefs.
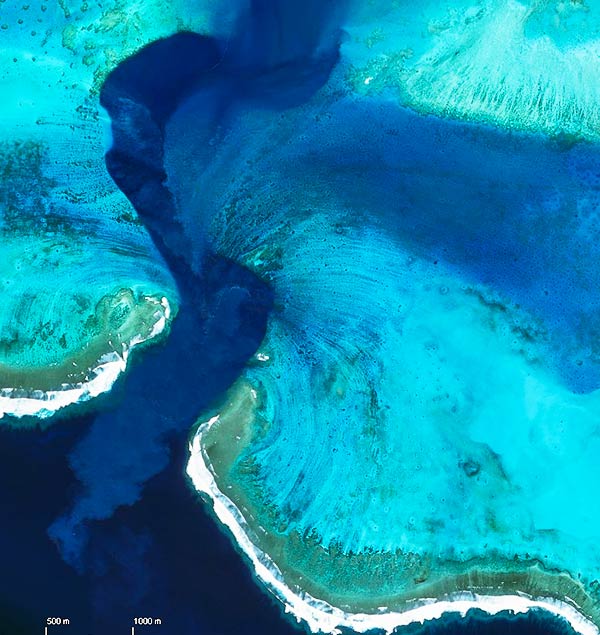
Can you blame me for my greed? I may never anchor here, nor transit this channel, but damn it, I still want the image on my chartplotter! -Rich